Introducing HoofMetrics: Racing Analysis With Nothing Hidden
16 June 2026·8 min read
Open almost any racing form site and you'll find the same handful of numbers: a jockey's wins, a trainer's strike rate, a sire's stakes tally. Useful, but shallow — and almost always quoted without the one thing that decides whether a number is worth anything. We built the HoofMetrics Stats Hub to go several layers deeper, and we'll say it plainly: it is the most detailed, most honest view of Australian and New Zealand racing form anywhere on the internet. Here's what's in it, and how to read it.
Most stats services quietly narrow their scope — TAB meetings only, metro only, the big tracks. Our Stats Hub covers every settled run at every AUS and NZ meeting this season, TAB and non-TAB, from Randwick on Derby Day down to a Tuesday picnic meeting in the bush. Season-to-date, updated every morning, settled from our own results database.
That completeness is why our numbers line up with the commercial form services rather than a thinned-out subset — a sire's individual-runner and winner tallies, for instance, match the official leading-sires tables almost to the horse. You're seeing the whole picture, not a convenient slice of it.
Across jockeys, trainers, jockey-and-trainer combinations and sires, every leaderboard carries A/E — actual versus expected. It's one of the most telling numbers in racing: plenty of the better services compute it, but a lot of form pages still bury it or leave it off, and we put it front and centre on every table.
A/E compares how often someone actually wins against how often the market expected them to. An A/E of 1.00 means they're performing exactly in line with their prices — fair value. Above 1.00 means they're beating what punters paid for; below means they're over-bet. It's the difference between "this trainer wins a lot" (often just because they run short-priced favourites) and "this trainer wins more than the price said they should" — and only the second one makes you money. We compute it from real starting prices over real runners, not an estimate.
A/E is valuable wherever you find it. What you can't do anywhere else is take it — or any number on these tables — and slice it down to the exact pocket of racing you care about. That ability to filter and re-cut every stat is what makes HoofMetrics one of a kind, and it's where the rest of this gets interesting.
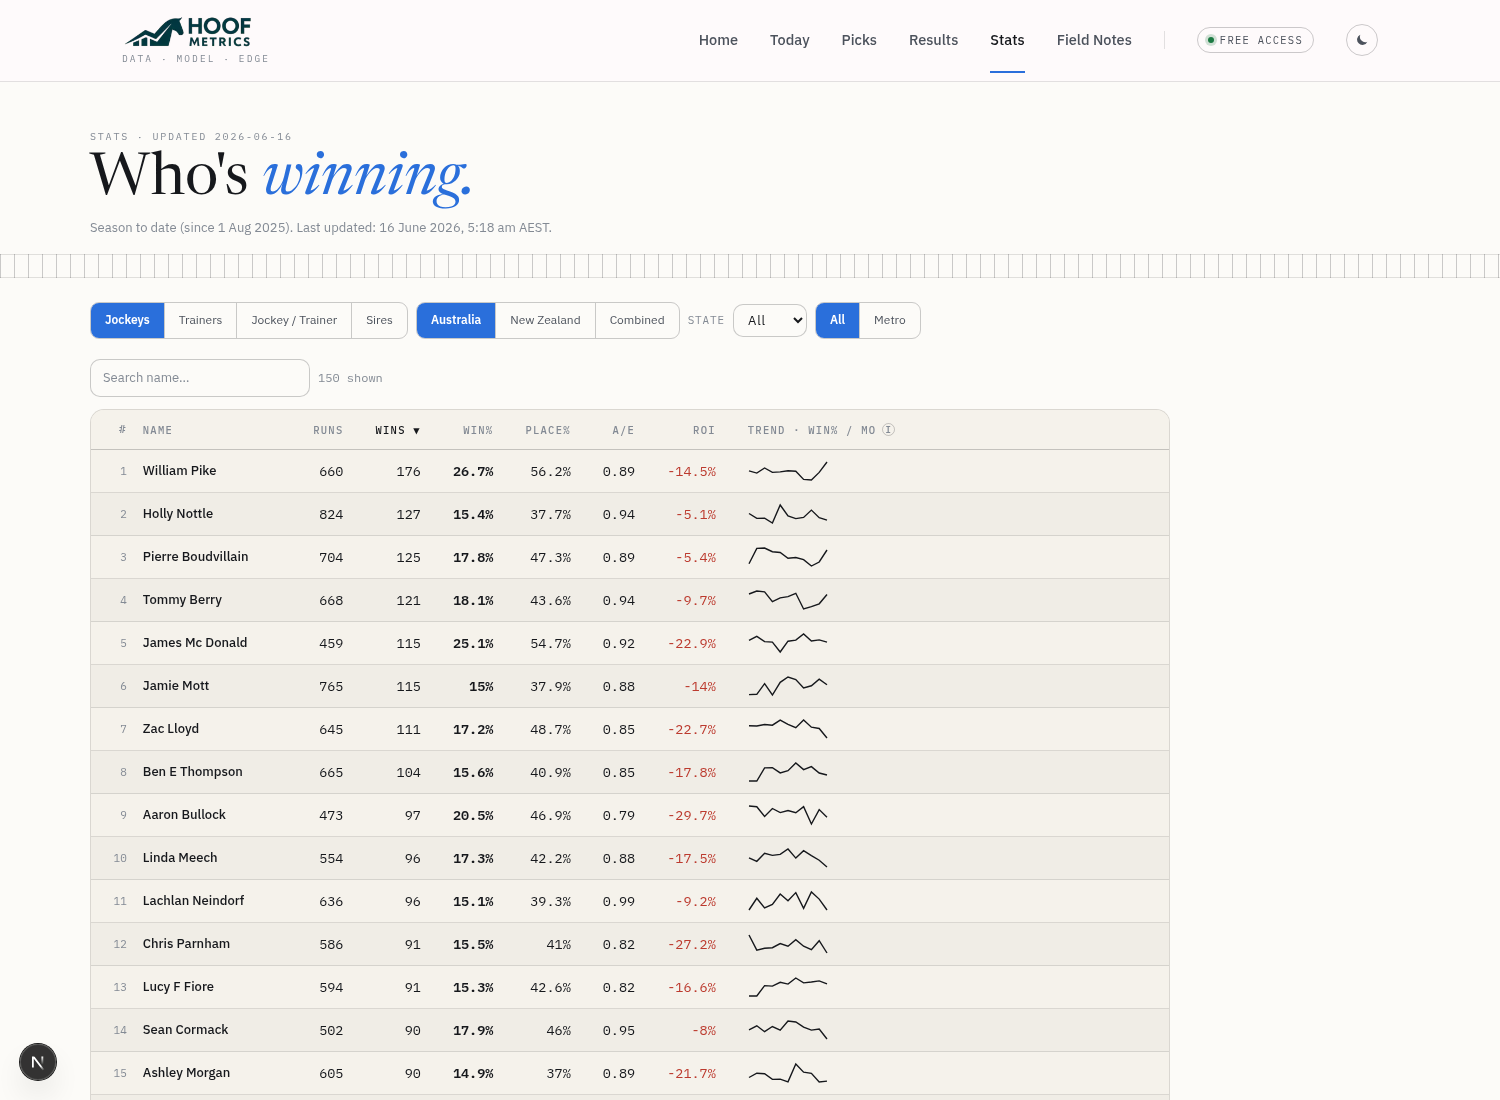 Every leaderboard pairs the familiar counts with A/E, level-stakes ROI and a season trend line.
Alongside A/E sits a level-stakes ROI for every name, win and place strike rates, and a little trend sparkline showing how each performer's win rate has moved month by month through the season. Toggle the whole board between Australia, New Zealand and Combined, narrow to a single state (NSW, VIC, QLD, WA, SA, TAS, ACT, NT), or switch to a metro-only heatmap that shows who fires at which city track. Every column is click-to-sort, and there's a live search box on every table.
The Jockey / Trainer tab is where a lot of value hides. Trainers book particular riders for a reason, and some partnerships run at a strike rate and A/E that neither party manages alone.
 Two hundred jockey–trainer combinations, each with its own strike rate, A/E and ROI — sortable and searchable.
Sort by A/E or ROI instead of raw wins and the picture changes completely: you stop seeing the busiest partnerships and start seeing the most profitable ones — the booking that, when it appears on the program, has genuinely been worth following.
This is where the Stats Hub pulls away from everything else. Pedigree and breeding analysis usually means a static earnings table. Ours is a live, sliceable model of every sire's progeny this season.
 Sires in Individuals view, sorted by progeny earnings — with age, distance, going and meeting filters that all combine.
Start with the Individuals ↔ Totals toggle. Individuals (the default) counts distinct progeny — how many of a sire's horses actually ran, won and placed, the way breeding services report it. Totals switches to total runs and wins. Then slice it however a serious analyst would want to:
Every one of those filters combines, and — this is the hard part most tools get wrong — the distinct runner and winner counts recompute exactly as you do it. Ask for "3yo progeny on Soft going at 1600m in Victoria" and you get the true number of individual horses behind it, not a double-counted approximation. Alongside that sit each sire's total progeny earnings, stakes record (black-type starts · wins · places) and black-type wins broken out by grade (G1/G2/G3/Listed) — plus the same A/E and ROI lens applied to the breeding barn.
A few principles run through all of it. The numbers are exact, not sampled — A/E from real prices, prize from each race's official per-position payout, distinct counts from the actual horses. They're updated daily and time-stamped so you always know how current they are. And we're upfront about the edges: progeny prizemoney is taken from official race breakdowns and excludes external bonus schemes (BOBS, VOBIS, breeder bonuses), so it reads a touch under commercial earnings tables — and there's a note on the page saying exactly that. While we take all care compiling these stats from our own database, there may be small differences to official tables, and we'd rather tell you that than pretend otherwise.
The best way to appreciate the depth is to use it. Open the Stats Hub, sort the trainers by A/E to see who's genuinely beating the market this season, flip to Jockey / Trainer and re-sort by ROI, then open Sires, choose Individuals, and filter to 2yos on top of the ground. It's all free, all season-to-date, and all in one place.
We think it's the most informative racing-stats view going. Pull it apart and see if you agree.